
US natural gas prices once again launch a new week with an upward move. NATGAS continues upward movement launched on Friday. This move was triggered by forecasts for colder weather in key US heating regions over the next two weeks and therefore higher demand for natural gas.
US natural gas prices dropped around 70% between mid-December 2022 and mid-February 2023. While there were some upward corrections during this downward impulse, the one we are observing currently deserves a note. Taking a look at NATGAS chart at H4 interval, we can see that price broke above the 50-period Exponential Moving Average at the end of the previous week and it was the first such breakout since mid-December. This may hint that a large upward correction may be on the cards. A break above the upper limit of a market geometry at 2.816 would confirm bullish momentum.
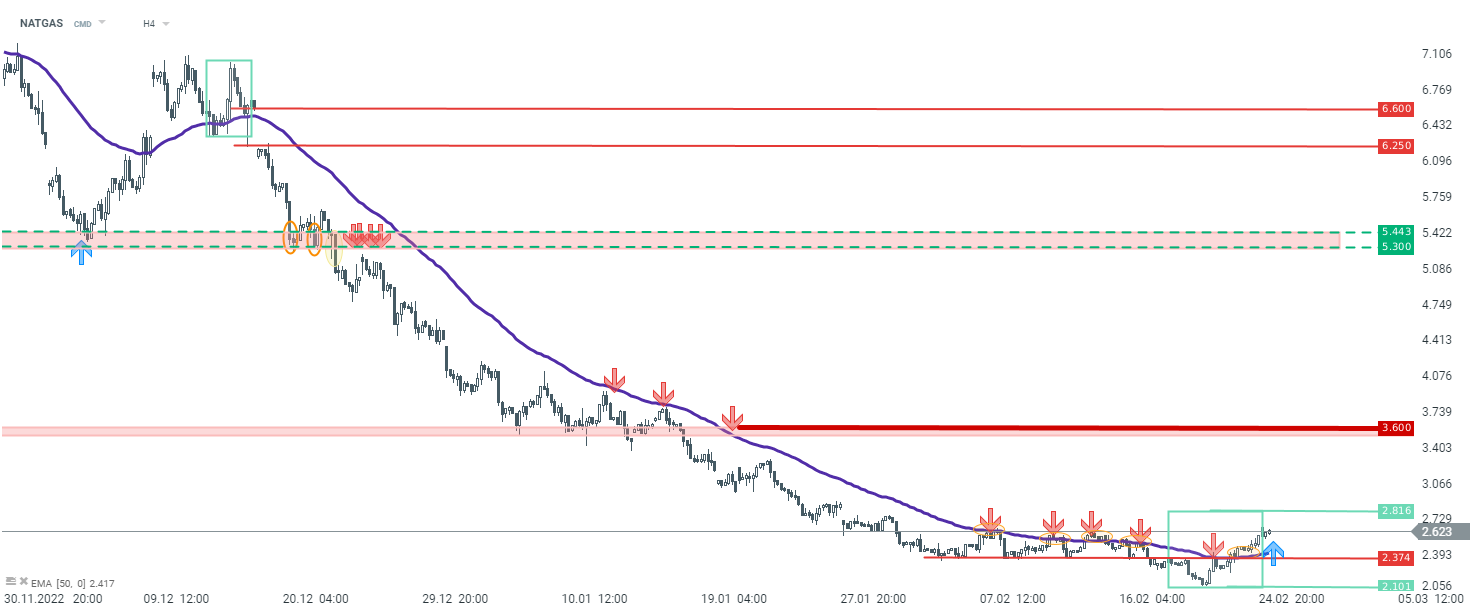 Source: xStation5

โกโก้ปรับตัวขึ้น จากแรงหนุนของอุปสงค์เอเชียที่ฟื้นตัว ขณะที่ยุโรปยังคงชะลอตัว

ทองคำยังยืนเหนือระดับ 4,000 ดอลลาร์ 🚩 แนวโน้มถัดไปของโลหะมีค่าจะเป็นอย่างไร?

Morning Wrap: ตลาดเอเชียปรับตัวลงตามแรงขายหุ้นเซมิคอนดักเตอร์สหรัฐฯ จับตาผลประกอบการ TSMC

Morning Wrap: จับตาทิศทางต่อไปของช่องแคบฮอร์มุซ เงินเฟ้อ และอัตราดอกเบี้ยสหรัฐฯ