
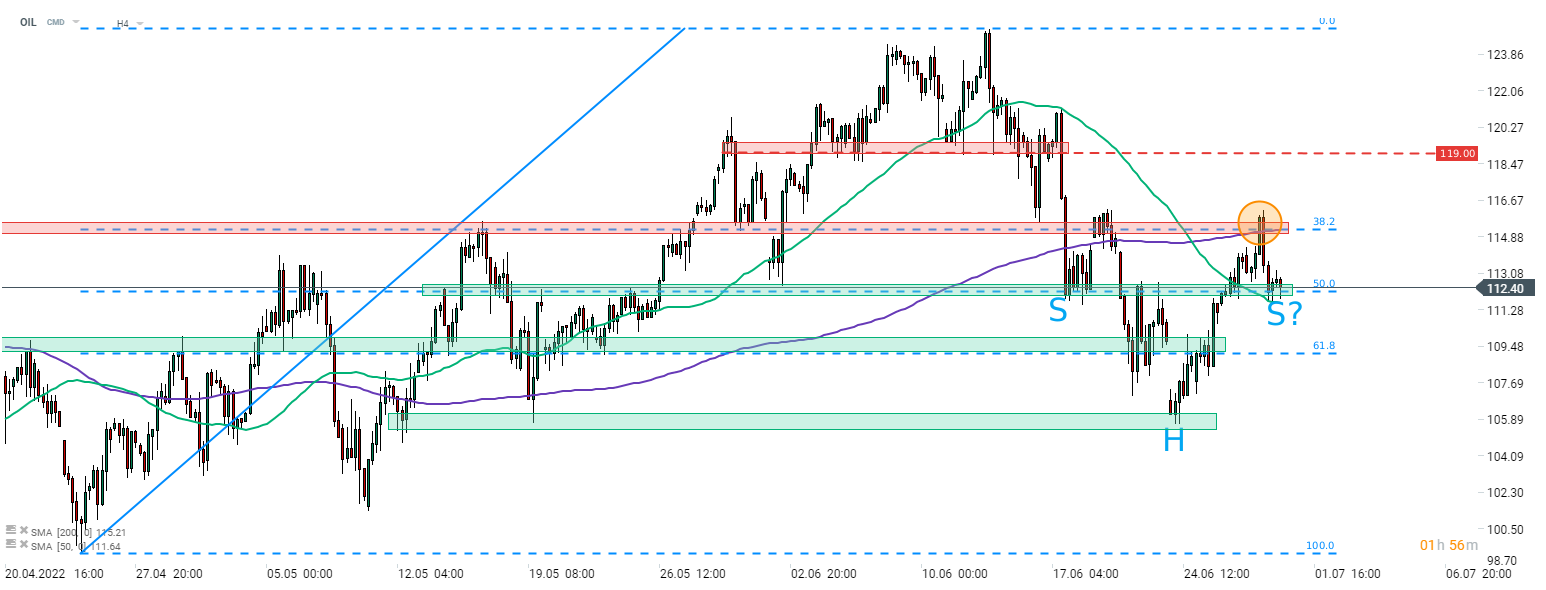
In spite of a bigger-than-expected drop in US oil inventories, oil prices failed to catch a bid. A strong reversal occurred on the Brent (OIL) market yesterday in the afternoon after price failed to break above an important short-term resistance in the $115.25 area (orange circle). This zone is marked with previous price reactions, 200-period moving average (H4 interval) as well as 38.2% retracement of a recent upward impulse. A following pullback pushed the price to the support zone marked with 50% retracement and 50-period moving average in the $112 area. A break below may signal that a deeper pullback is looming. However, if bulls manage to defend this area, a right shoulder of the inverse head and shoulders pattern may be painted. If such defense is followed by a recovery move that pushes price above recent highs near 38.2% retracement, a stronger upward move may be on the cards. Potential range of an upside breakout from this pattern points to a move towards recent highs in $125 area.
 Source: xStation5

🛢️ น้ำมันดิบ Brent ทดสอบระดับ $95 ต่อบาร์เรล

Morning Wrap: หุ้น AI และทองคำกลับมาได้รับความสนใจอีกครั้ง?

ข่าวเด่นวันนี้ 22 ก.ค.

ทะเลแดง แต่ไม่ใช่ดัชนีตลาด: ผลกระทบจากการปิดกั้นช่องแคบบับเอลมันดาบ