
Wall Street indices snapped a winning streak yesterday with S&P 500 finishing lower for the first time in 9 days. Nasdaq was the worst performing index as the tech sector was pressured by a plunge in Tesla shares. Russell 2000 dropped over 0.5% while Dow Jones pulled back around 0.3%.
Taking a look at Dow Jones (US30) at H1 interval, we can see that this index has pulled back from its recent all-time high and tested support zone at 36,060 pts. This level is marked not only with previous price reactions but also with the lower limit of a local market geometry (red box). A short-term downward trendline limited upward moves of the index throughout yesterday's Wall Street session and today's trading in Asia. A break above this trendline could hint at resumption of upward move and a possible attack on recent record highs. On the other hand, breaking below the 36,060 pts could pave the way for a deeper drop as, in theory, it would point to a reversal of short-term trend. In case today's US CPI data (1:30 pm GMT) shows a large deviation from consensus, Wall Street indices may become more volatile.
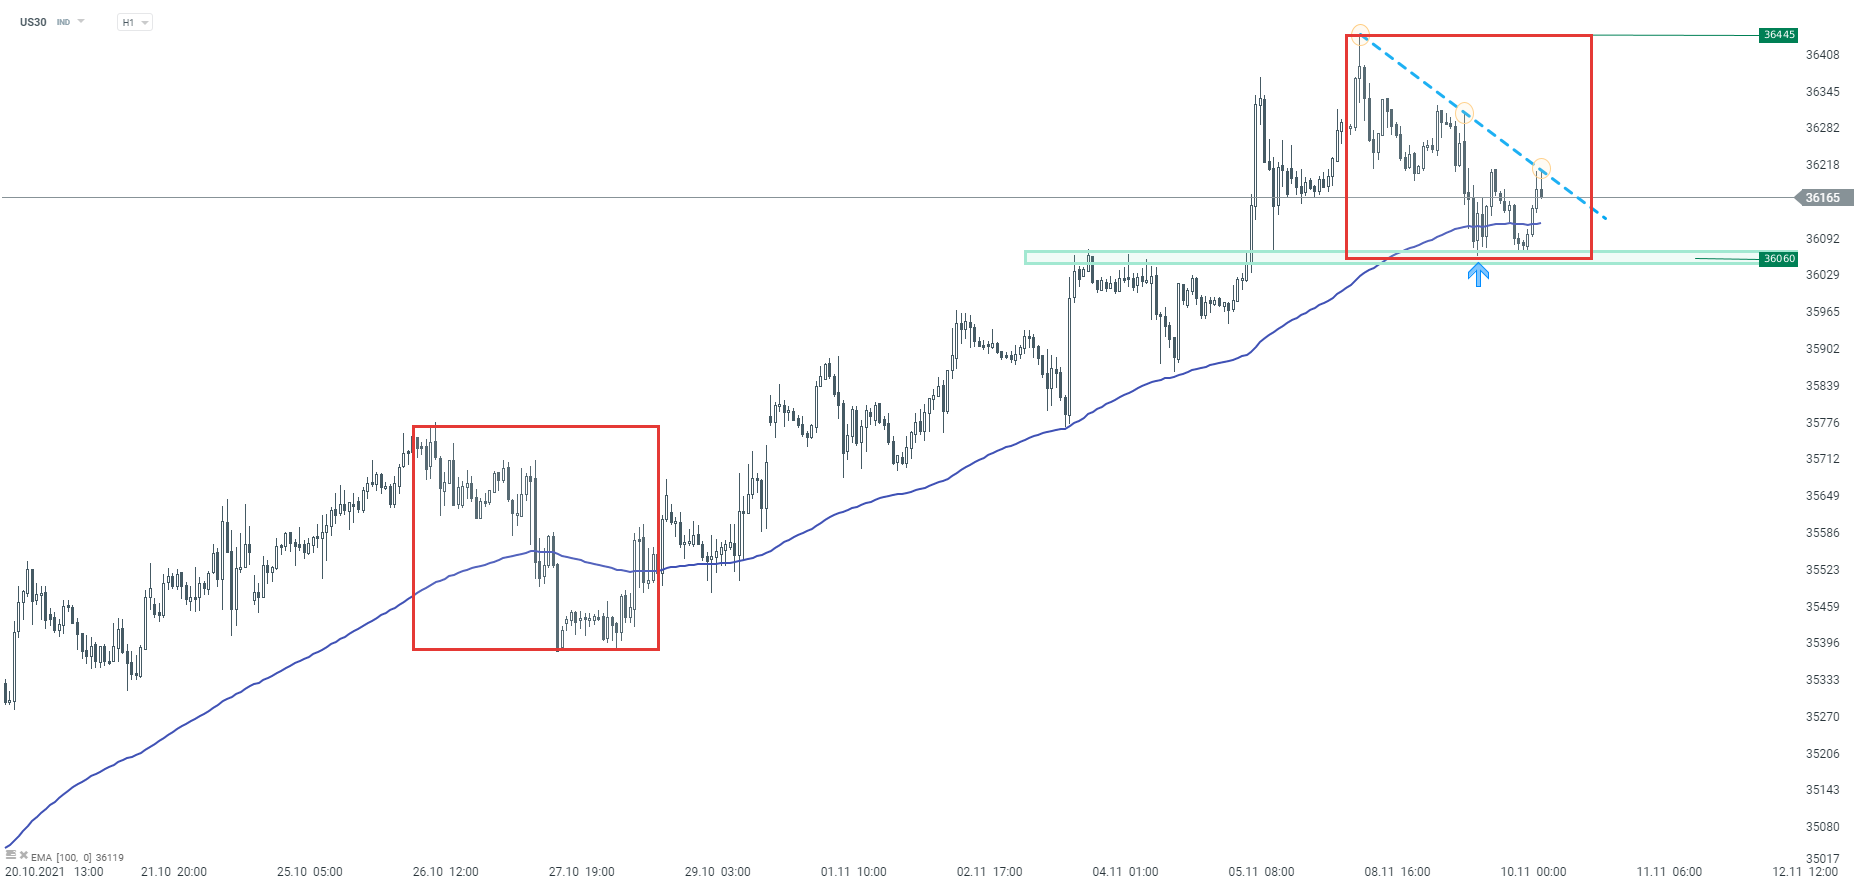 Source: xStation5

Market Wrap: AI CAPEX กลายเป็นแรงกดดัน 🚩 หุ้น Alphabet และ Tesla กดดันตลาดทั่วโลก (23.07.2026)

ข่าวเด่นวันนี้ 23 ก.ค.

กราฟประจำวัน: AI หนุนตลาดขาขึ้น – Tesla และ Google จะรักษาโมเมนตัมนี้ได้หรือไม่?

Economic Calendar: จับตาผลประกอบการ Tesla และ Google