
The US dollar index (USDIDX) resumed a downward move after a brief pause yesterday. The index erased earlier gains and swung to a daily loss, taking out yesterday's low in the process. As a result, USDIDX is trading at the lowest level since mid-August 2022. Recent US dollar weakness can be reasoned with somewhat weaker data from the United States, that has reignited hopes for a Fed pivot. Cooler-than-expected CPI reading for October saw market odds for another 75 basis point rate hike to diminish. Also Fed's Waller said that 50 basis point rate hike will be discussed for December meeting although he also stressed that a single dovish macro report, like recent CPI reading, is not enough to alter Fed's view that inflation is not yet under control. While certainly not as important and closely watched as CPI data, today's US PPI report for October may trigger some additional USD volatility.
Taking a look at USD index chart (USDIDX) at D1 interval, we can see that the index continues to move lower following an earlier break below the lower limit of a market geometry and the upward trendline. The next major support zone to watch can be found in the 105.00 area, and is marked with 38.2% retracement of the upward move launched at the beginning of 2021 as well as previous price reactions and 200-session moving average.
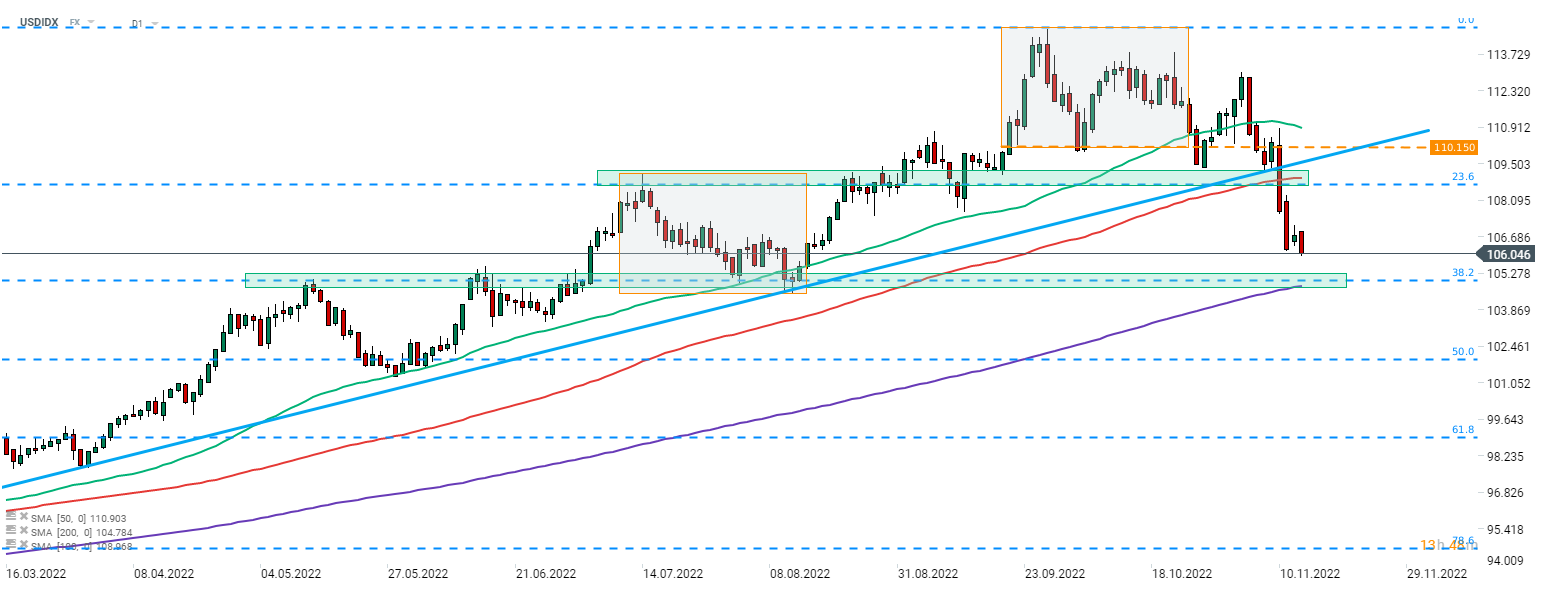 Source: xStation5

ปฏิทินเศรษฐกิจ: โฟกัส ECB Minutes, ตัวเลขผู้ขอรับสวัสดิการว่างงานสหรัฐฯ และงบ PepsiCo

FOMC Minutes ยืนยันมุมมองเข้มงวดด้านนโยบายการเงิน ขณะที่ EURUSD กลับมารีบาวด์ได้อีกครั้ง
ดอลลาร์ฟื้นตัวแรง: ความขัดแย้งในตะวันออกกลางกลับมาอีกครั้ง กดดันตลาดเงินทั่วโลก

ข่าวเด่นวันนี้ 9 ก.ค.