
The EUR/USD has retested a key support zone, which led to the cessation of the sell-off in the currency pair.
This support zone, identified at 1.07, has been supporting the price since November 2023 and may also be regarded as the lower boundary of the current medium-term consolidation.
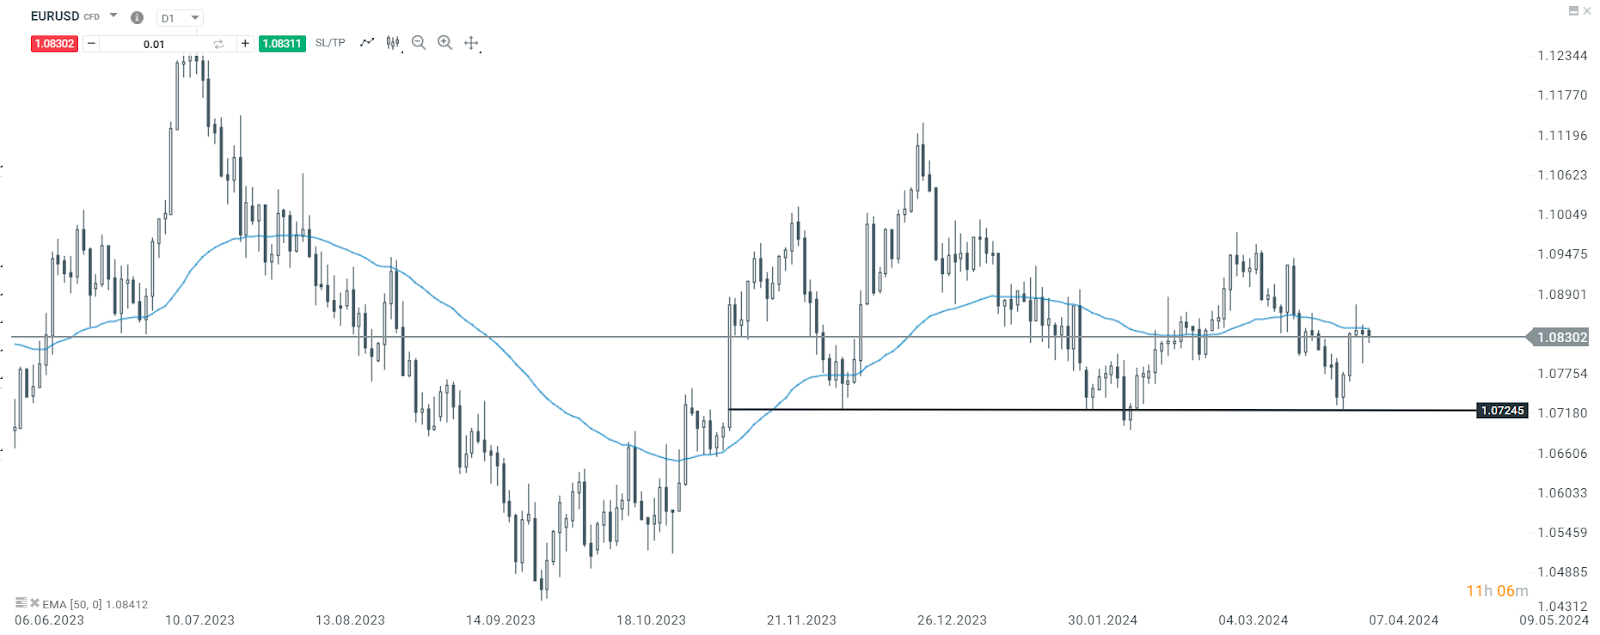
EUR/USD Daily time frame chart. Source: xStation 5
However, on the 4-hour chart, it's apparent that the price is approaching the first significant obstacle that could determine the next momentum in the pair. The downward trend line initiated at the end of February this year and has been extending since.
If buyers succeed in breaking above this zone, the upward movement could be prolonged. Conversely, if sellers regain control of the price at this juncture, a new downward trend cannot be discounted, potentially towards the 50-period EMA.
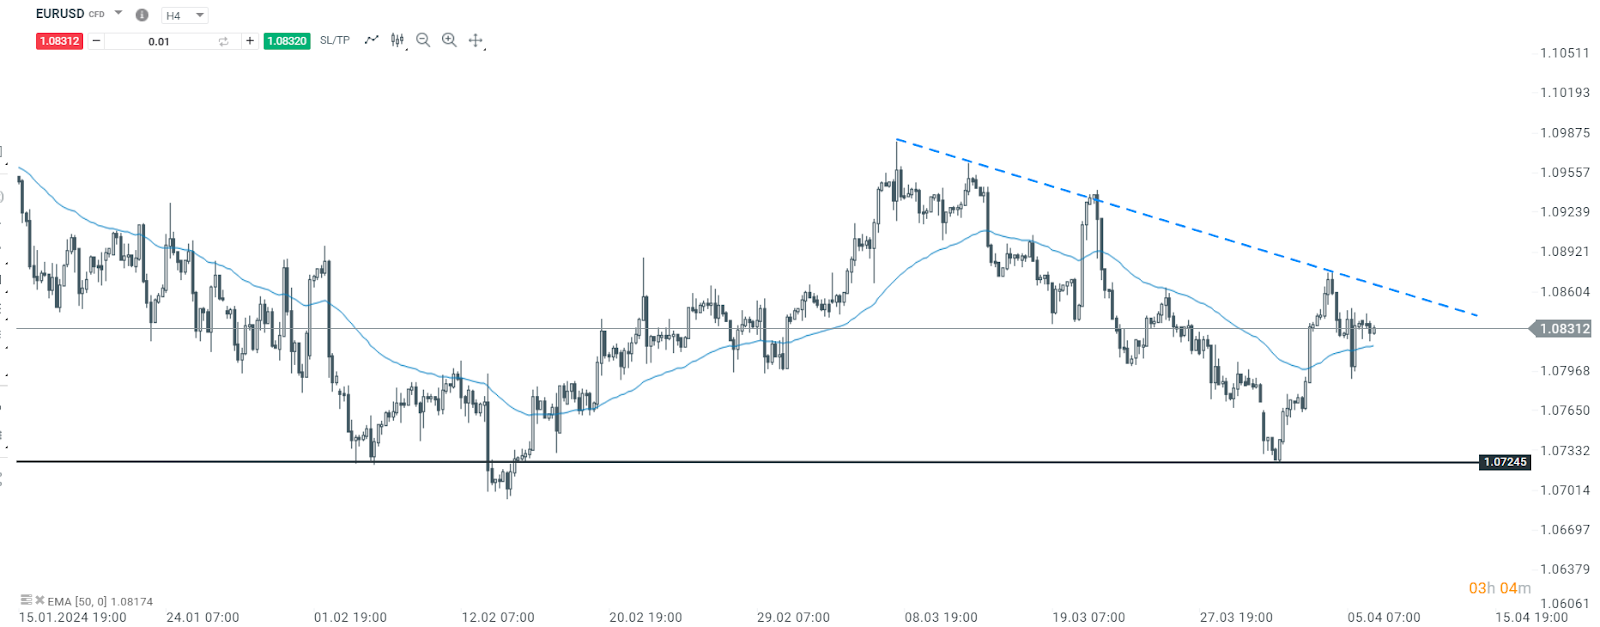
Eur/usd. 4 hours time frame chart. Source: xStation 5
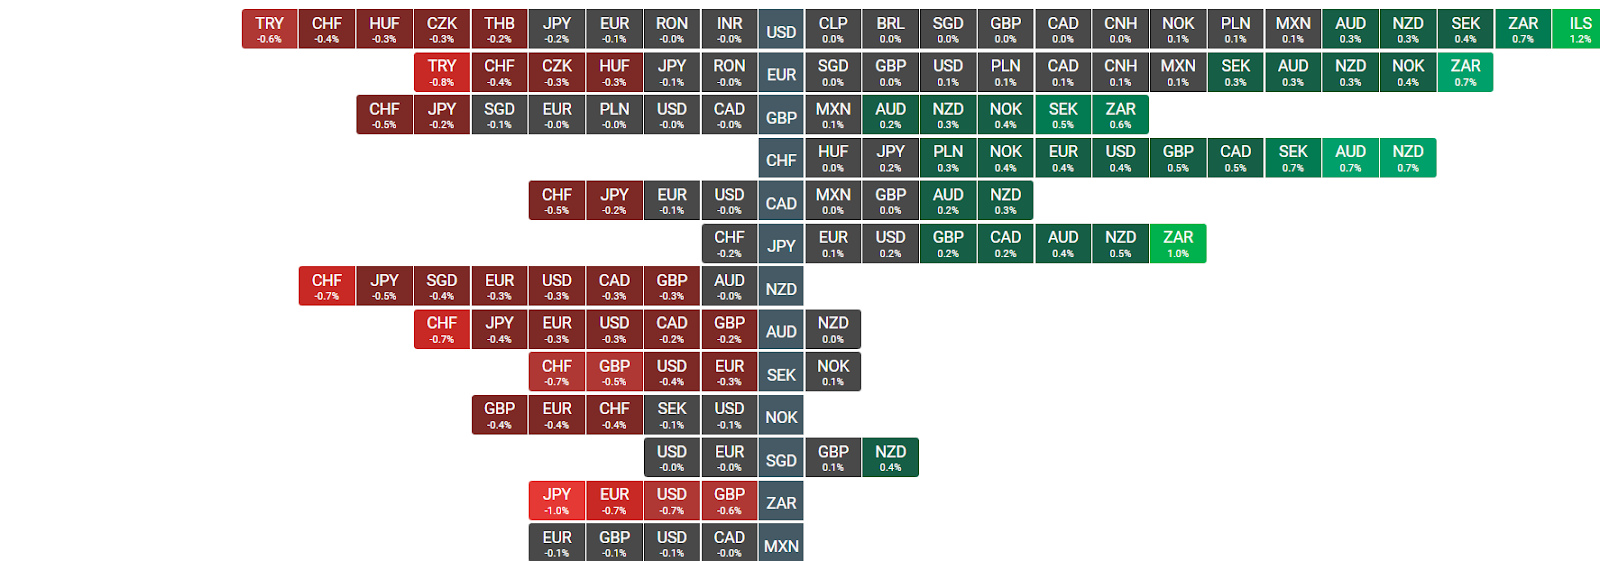
Forex Heatmap. Source: xStation 5
Henrique Tomé,Analyst Portugal

Morning Wrap: จับตาทิศทางต่อไปของช่องแคบฮอร์มุซ เงินเฟ้อ และอัตราดอกเบี้ยสหรัฐฯ

ข่าวเด่นวันนี้ 15 ก.ค.

Warsh ตอบคำถามต่อสภาคองเกรส: เสถียรภาพเงินเฟ้อคือกุญแจสำคัญของ Fed

ดอลลาร์ร่วง หลังราคาสินค้าในสหรัฐฯ ลดลงครั้งแรกในรอบ 6 ปี